Free Template · XLSX · 8 sheets · 69 formulas

    TCO Calculator: what procurement software really costs over three years

    The licence price is the visible part. This calculator adds the three layers that show up afterwards — acquisition, operation and risk — projects them over the horizon you set, and ranks up to three alternatives by total cost of ownership.

    By Oscar Gamboa, CEO of EGIXIA · Updated August 11, 2026 15 minutes to complete

    100% free · We send the link to your corporate email

    The workbook is in Spanish and works in a single currency. Its formulas behave identically in Excel and Google Sheets.

    What is TCO, and why is the licence price not enough?

    Total cost of ownership (TCO) is everything an organisation pays to use something across its useful life, not just to acquire it. For a procurement platform that means the licence quote sits alongside implementation, master data migration, training, support, ERP integrations and the internal hours someone has to spend administering it.

    The distortion appears when those items get assessed at different moments: the licence is compared in the sourcing committee and the rest surfaces in next year’s budget. An alternative that looks cheaper in the first column can end up the most expensive in the last one, and the comparison presented to leadership never showed it.

    This calculator forces all of them onto the same table. Three alternatives, the same cost lines for all three, and a third layer that almost never gets quantified: the expected cost of risk, computed as likelihood times impact for four typical events. The output is a comparable number and a sheet where you can see exactly where it came from.

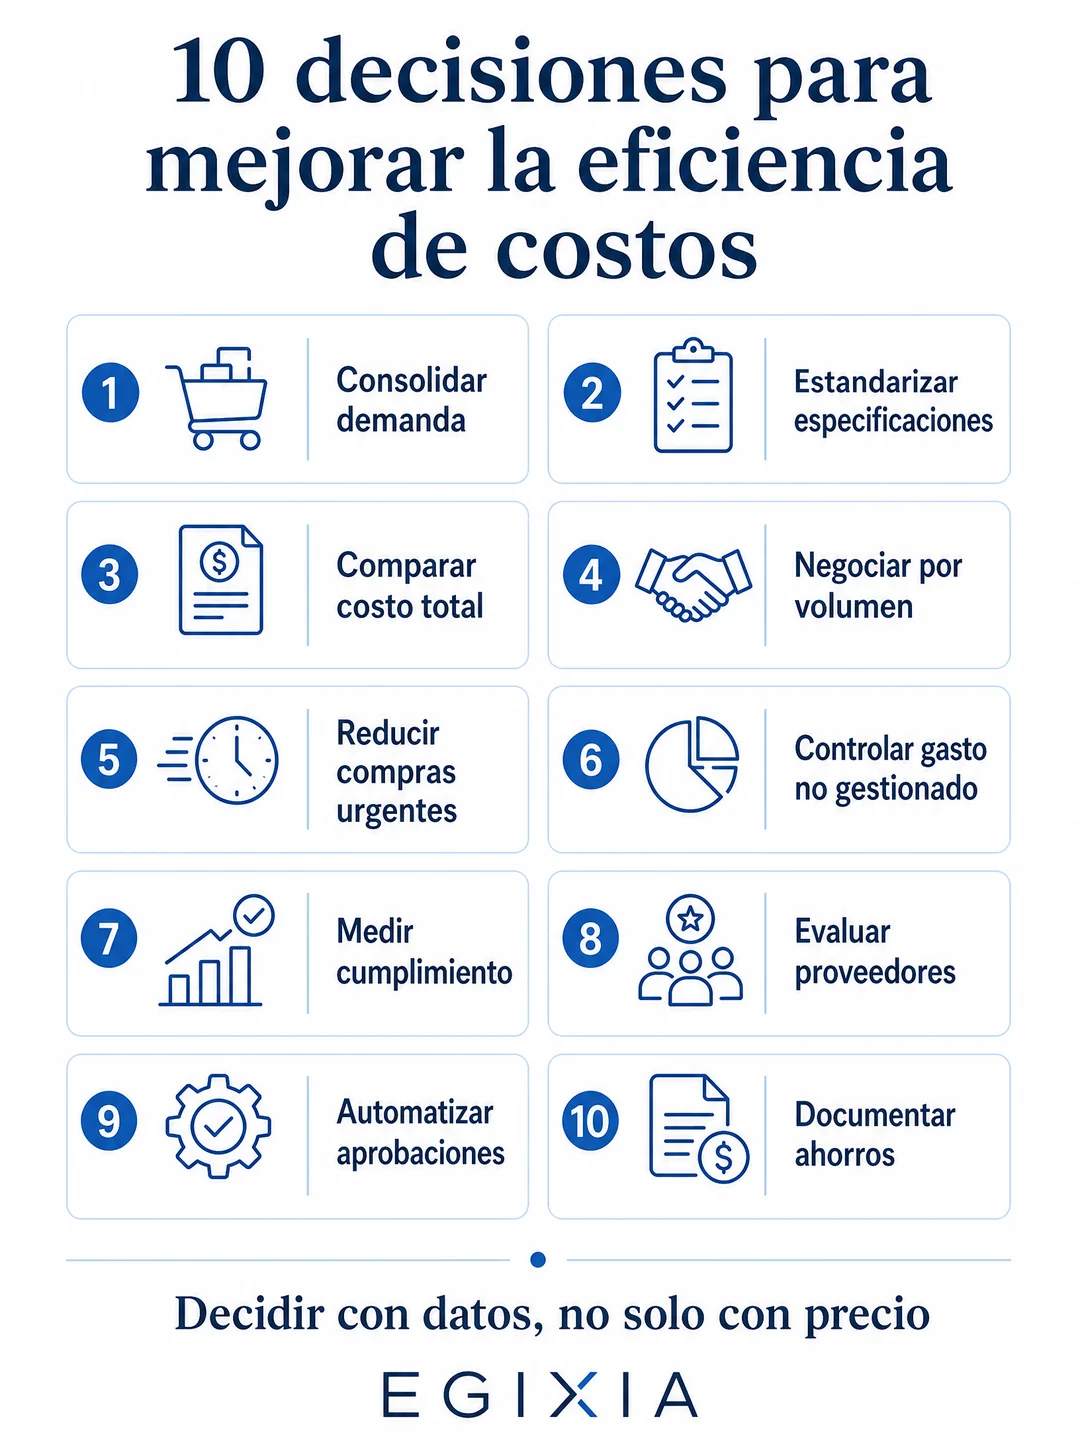
    Cost efficiency decisions in procurement: compare total cost and decide with data — Egixia
    Comparing total cost — not just price — is one of the ten decisions that move procurement cost efficiency the most. This calculator is the instrument behind that decision.

    The 8 sheets, one by one

    This is not a blank form: 69 formulas wire the sheets together. You load costs into the three capture sheets, and the comparison, the summary and the sensitivities update on their own — nobody copies a number between tabs.

    Resumen Ejecutivo — executive summary

    The sheet you take to the committee: acquisition cost, operating cost, risk cost, annual TCO and three-year TCO for all three alternatives, every figure pulled by formula from the detail sheets. It closes with the caveat that the lowest-TCO alternative still has to be validated against technical, strategic and risk criteria and your internal policies.

    Datos Base — base data

    The four parameters that govern the whole model: a single currency, the horizon in years (ships at three, editable), annual volume and the name of each alternative. The names you type here are the ones that later appear in the comparison and in the chart.

    Costos de Adquisición — acquisition costs

    Six line items: unit price, unit freight or transport, non-recoverable duties and taxes, initial implementation, initial training and transition costs. The first three are multiplied by annual volume; the last three enter as one-off costs.

    Costos Operativos — operating costs

    Another six line items, all annual: maintenance, support or subscription, inventory cost, administrative and management cost, energy or operation, and an open line for other recurring costs your case has and the template did not anticipate.

    Costos de Riesgo — risk costs

    Four risks — supply disruption, non-conformity or rework, SLA breach, and regulatory or contractual risk — each with its likelihood and impact per alternative. The sheet computes the expected value of each and adds them up. This is the layer that turns "this supplier is riskier" into a figure you can actually add.

    Comparativo de Alternativas — comparison

    The consolidation: the three cost layers, annual TCO, three-year TCO and a RANK formula that orders the three alternatives from lowest to highest. It includes a bar chart of three-year TCO and a three-colour scale over that row.

    Sensibilidades — sensitivities

    A base scenario plus three stress scenarios — price up, operation up and risk up — that recalculate three-year TCO for all three alternatives without touching the original data. It answers the question that always comes: "and what if the assumption moves?".

    Instrucciones — instructions

    Five usage steps plus the printed warning: the calculation is an estimate based on your assumptions and is not a financial projection, a savings guarantee or an automatic award recommendation.

    How TCO is calculated

    The logic is written in the cells, not hidden in a macro: you can open it, argue about it with Finance and change it if your methodology differs.

    TCO over N years = acquisition cost + (annual operating cost + annual risk cost) × N
    Annual TCO = acquisition cost + annual operating cost + annual risk cost
    • Acquisition cost enters once across the horizon, not once per year: implementation, training and transition are paid at the start. Operating and risk costs are the ones multiplied by the number of years.
    • Inside acquisition cost, unit price, freight and non-recoverable taxes are multiplied by the annual volume from the Datos Base sheet; implementation, training and transition are added as they are.
    • Each alternative’s risk cost is the sum of likelihood × impact across the four risks. It is an expected value, not a forecast: it exists to compare alternatives against each other, not to book a provision.
    • The ranking uses RANK over three-year TCO in ascending order: number 1 is the cheapest alternative across the full horizon, which is not always the cheapest in the first column.

    The three cost layers the model adds up

    Each layer has its own capture sheet and its own total formula. The comparison adds them; the summary shows them separately so the committee can see which of the three explains the gap.

    LayerSheetLinesWhat it captures
    AcquisitionCostos de Adquisición6 line itemsWhat you pay to get the solution running: price, per-unit accessory costs and the three one-off start-up costs.
    OperationCostos Operativos6 line itemsWhat you pay every year to keep using it: maintenance, support or subscription, inventory, management, operation and other recurring costs.
    RiskCostos de Riesgo4 risksThe expected value of what can go wrong: likelihood times impact, alternative by alternative, documented on the same sheet.

    How to apply it to a procurement platform

    The workbook is written in generic terms so it serves any buying decision — equipment, a material, a service or software. If what you are evaluating is a procurement platform, this is how to read each line. Nothing needs renaming: you only need to know what goes in each cell.

    Line in the workbookWhat to enter when evaluating procurement software
    Unit price × Annual unitsPrice per user or per licence, multiplied by the users for the year. If your contract is a flat fee, set annual volume to 1 and enter the full fee as the unit price.
    Initial implementationConfiguration, workflow set-up, supplier master data migration and the consulting hours of the roll-out.
    Initial trainingTraining for buyers, finance and the requesting areas, including the reinforcement sessions of the first months.
    Transition costsThe parallel run with the previous system, the development of ERP integrations and the data clean-up before loading.
    Maintenance + annual support / subscriptionSubscription renewal, the support tier you contracted, maintenance of the integrations and the block of hours for enhancements.
    Administrative / management costThe internal IT and procurement hours spent administering the system: user provisioning, catalogues, approval flows and reporting.

    Lines that do not apply to your case — freight, duties, inventory or energy, if you are evaluating software — are left at zero and drop out of the total without breaking any formula.

    This is not the ROI calculator: they are two halves of the same case

    They answer different questions, and mixing them is a bad idea. The ROI calculator answers how much automating the procurement process gives back: hours freed, rework removed, cycles shortened. This calculator answers what this platform really costs over N years, adding up what rarely shows in the quote.

    A serious business case uses both: TCO is the denominator — the full investment, not just the licence — and ROI is the numerator. Presenting the return without the total cost is what turns an approved project into an uncomfortable conversation in year two. And when the decision is between specific platforms, TCO is precisely the axis of the comparisons.

    What is inside

    69 chained formulas

    The three cost layers feed the comparison, the comparison feeds the summary, and the sensitivities read the three layers again. Changing one assumption updates the whole workbook.

    Three alternatives side by side

    A, B and C with exactly the same cost lines, and a RANK formula that orders them by three-year TCO. Comparing like with like is half the decision.

    Chart and colour scale

    A bar chart of three-year TCO per alternative and a three-colour scale over that row: cheapest in green, most expensive in red, nothing left to eyeballing.

    Four scenarios

    A base case plus three stress cases — price, operation and risk moving up — that recalculate TCO for all three alternatives without touching the original data. The answer to "what if we are wrong?" is already on the sheet.

    What the workbook does not do (worth knowing before you present it)

    • The values it ships with are placeholders so you can see how the model behaves. They are not Egixia reference prices, nor market prices: replace them with your own quotes before drawing any conclusion.
    • It does not discount the time value of money. It computes nominal sums, not net present value or internal rate of return. If your investment committee requires them, take the flows by layer and discount them separately.
    • It works in a single currency and does not convert exchange rates. If one alternative quotes in dollars and another in local currency, convert before loading.
    • One-off costs enter once, at the start. If your contract includes a one-off payment in year two — a second deployment wave, for instance — add it manually where it belongs.
    • The calculation is an estimate based on your assumptions: it is not a financial projection, a savings guarantee or an automatic award recommendation. The lowest-TCO alternative must still be validated against technical, strategic and risk criteria and your organisation’s internal policies.

    Frequently asked questions about procurement software TCO

    What is the TCO of procurement software, and what does it include?

    Total cost of ownership is everything the organisation will pay to use the platform across the horizon you evaluate, not just the licence. This calculator organises it into three layers: acquisition (price, implementation, training and transition), operation (maintenance, support or subscription, administration and other recurring costs) and risk (the expected value of four typical events, computed as likelihood times impact). The three are added up on the comparison sheet.

    How is three-year TCO calculated in this template?

    With an explicit formula: TCO over N years = acquisition cost + (annual operating cost + annual risk cost) × N. Acquisition cost enters only once, because implementation, training and transition are paid at the start; operating and risk costs are multiplied by the number of years in the horizon, which ships at three and is editable on the Datos Base sheet. A RANK formula then orders the three alternatives from lowest to highest.

    How is it different from the procurement automation ROI calculator?

    They answer different questions. The ROI calculator estimates how much automating the procurement process gives back: hours freed, rework avoided and shorter cycles. This calculator estimates what a platform really costs over several years, including what does not appear in the quote. A business case uses both: TCO is the full investment and ROI is the return you compare against it.

    Are the values it ships with market reference prices?

    No, and it matters not to read them that way. The cost cells arrive with example figures whose only purpose is to make the model return a result the moment you open the file, so you can see how a change propagates. They are not Egixia rates, industry averages or any vendor’s quote. Delete them and load your own numbers before sharing the result with anyone.

    Can I use it to compare Egixia with Coupa or SAP Ariba?

    Yes: the workbook compares up to three alternatives across the same cost lines, so you can put one platform in each column. What the calculator does not do is supply the prices — you load the quotes and the implementation, integration and support estimates each vendor gives you. Egixia.com also publishes point-by-point qualitative comparisons against Coupa and against SAP Ariba.

    Is it free, and what format does it arrive in?

    Yes, it is free. We ask for your name, company and corporate email so we can send you the download link — no spam chains. It arrives as an .xlsx file in Spanish, with eight sheets and 69 formulas already written, compatible with Excel and Google Sheets.

    Download the TCO calculator — free

    Leave your corporate email and we will send the link instantly. Eight sheets, 69 formulas, three alternatives side by side, annual and three-year TCO, four sensitivity scenarios and a comparison chart ready for the committee.

    The download link is sent to your corporate email.

    The workbook is in Spanish and works in a single currency. Its formulas behave identically in Excel and Google Sheets.

    🙏 Found it useful? Help us reach more procurement professionals by following us on LinkedIn.

    Follow Egixia on LinkedIn

    Want to test your model against a real case?

    Bring your sheet with the numbers loaded and we will review it together: which items usually go missing, which ones are overstated, and what the TCO of an Egixia implementation looks like in your context. Thirty minutes, no strings attached.

    Schedule strategic demo